How to Catch Hydration Errors That Only Occur in Production Using Binary Search
A real debugging playbook for isolating a React hydration error that only surfaced in production in 30 minutes using controlled variables and bisection. Also sharing the 400-line in-house error monitoring setup that caught it.
At 8 PM, an alert arrived in the error monitoring channel for a live site.
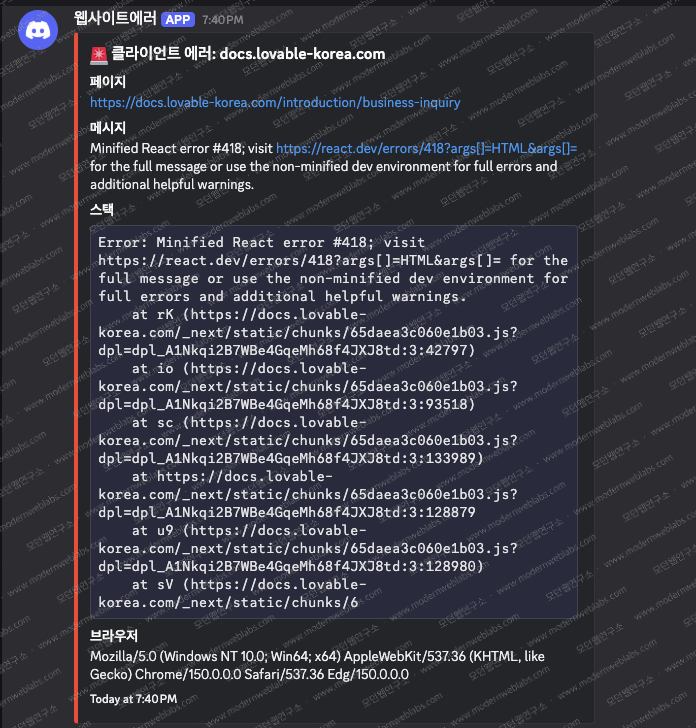
React error #418 is a hydration failure. Hydration fails when the HTML rendered by the server does not match the React tree the client produces. The problem was that this error checked every box for being unusually hard to debug.
The production bundle minifies the error message, so there is no hint about the cause.
Running a production build locally does not reproduce it.
React re-renders the tree on the client and recovers automatically, so the screen looks fine.
Because the screen looked fine, no users reported anything. Without a monitoring system, we would not have known this bug existed. What follows is the exact procedure we used to catch this error without guessing. Before walking through the procedure, let me explain how the alert reached us in the first place.
Step 0, set up the watch before the bugs arrive
This site does not use an external error monitoring service like Sentry. The entire setup is homegrown: one instrumentation file, one API route, one smoke test script, and a Discord webhook, totaling roughly 400 lines. The watch is organized into three layers.
File | Role | Total | Excl. comments & blanks |
|---|---|---|---|
| Layer 1, browser instrumentation | 90 lines | 77 lines |
| Layer 2, server relay + Discord webhook | 160 lines | 132 lines |
| Layer 3, smoke test | 112 lines | 87 lines |
| Layer 3 execution workflow | 48 lines | - |
Layer 1, instrumentation in real users' browsers: If you place an instrumentation-client.ts file at the project root, Next.js runs the code in that file before any application code, letting you implement logic that runs first no matter which page a visitor lands on. Modern Web Labs used this to build a simple instrumentation system: attach listeners to the window object's error and unhandledrejection events, and only activate them in production.
// instrumentation-client.ts. Enable instrumentation only in production
if (process.env.NODE_ENV === 'production' && typeof window !== 'undefined') {
  window.addEventListener('error', (event) => {
    const error = event.error as Error | undefined;
    const message = error?.message ?? event.message ?? 'Unknown error';
    if (isNoise(message, error?.stack, event.filename)) return;
    send({ url: window.location.href, message, stack: error?.stack,
           userAgent: navigator.userAgent });
  });
  window.addEventListener('unhandledrejection', (event) => { /* same pattern */ });
}
If you forward every error the listeners catch to a Discord channel, Discord fills up with noise almost instantly. So we decided to filter out three categories of errors before sending anything.
Errors from browser extensions (stack contains
chrome-extension://)Errors from analytics scripts loaded by GTM (Google Tag Manager) themselves (stack contains none of our bundle path
/_next/)Contentless cross-origin errors (just a single
Script error.line, nothing actionable)
On top of that we set a per-session cap of 3 reports, and to avoid losing error reports even during page unload, we call navigator.sendBeacon first and fall back to fetch keepalive if that fails.
Layer 2, server relay route: If the browser calls the Discord webhook directly, the webhook URL ends up in the bundle, and anyone can spam the channel. So we placed a /api/monitor/client-error route in between. This route checks that Origin and the page URL belong to our domain, excludes reports from headless browsers (used by the smoke tests), deduplicates identical messages for 10 minutes, and enforces a cap of 20 reports per hour. Deduplication is instance-memory based (serverless), so it resets on cold start, but we judged that this is sufficient for preventing alert floods. Only errors that pass this filter are forwarded to Discord along with page, message, stack, and browser information. The alert at the top of this article is in exactly this format. Hydration-family errors (#418, #423, #425) are auto-classified by message pattern, and we attach interpretive hints to the alert such as "Auto-recovered. May be caused by the visitor's browser translation or extensions. Suspect a site bug if it recurs on the same page." This is so that if the alert arrives at dawn, we can judge from the alert itself whether to get up immediately or leave it for morning.
Layer 3, smoke tests: Real-user instrumentation is the layer that tells you about errors that have already fired. But errors need to be caught before visitors experience them, which requires a separate layer. To that end, we set up GitHub Actions to run Playwright immediately after a successful production deploy and every 6 hours, cycling through key pages to check for client exceptions and error screens, sending alerts to the same Discord channel on failure. The traversal does not visit URLs by typing them in directly. It uses Playwright to move as if the visitor had actually clicked the links, because there are regressions that only surface in Next.js soft navigation.
In household terms, layer 1 is the fire alarm and layer 3 is the periodic safety inspection. A device that only alerts you after the fire starts and an inspection you run before any fire cannot substitute for each other. This particular error was caught by the fire alarm. Now let me walk through the procedure I used to resolve it.
Step 1, Reproduce the exact production conditions
When you hit a production error that will not reproduce locally, the first question to ask is, "What is different about the build conditions?"
In Next.js, NEXT_PUBLIC_* environment variables are inlined into the bundle at build time. If a value exists in the production build but not the local build, the two bundles are literally different code. These values are exposed to the client anyway, so you can extract them back out from the deployed page.
curl -s https://example.com/page | grep -oE 'GTM-[A-Z0-9]+' # GTM-XXXXXXXA command like the one above pulls out the Google Tag Manager ID with no effort. Plugging the same value into a local build reproduced the error immediately.
NEXT_PUBLIC_GTM_ID=GTM-XXXXXXX npm run build && npm startThere is a common trap here: concluding that "it only breaks when GTM is on, so GTM is the cause." Not yet. GTM is a reproduction condition, not proven to be the cause. As it turned out later, the actual cause had nothing to do with GTM. The GTM script simply changed the node count in the head, which acted as a catalyst that promoted a dormant mismatch into a full crash.
Step 2, line up the suspects
The error was happening only on a specific page. Using the same build, I checked every other page first to pin down which page was actually breaking.
/ → OK /introduction/getting-started → OK /features/plan-mode → OK /introduction/business-inquiry → Error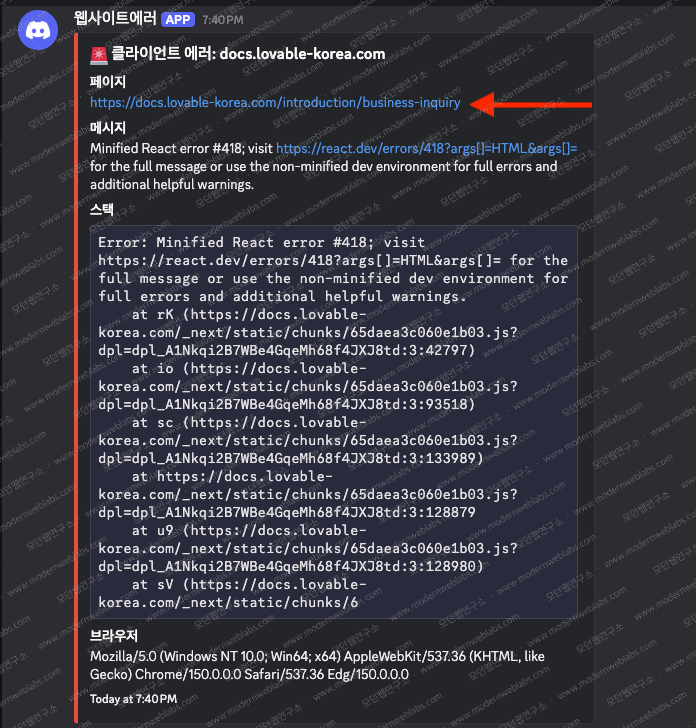
Anything unique to the failing page naturally becomes a suspect. Three things existed only on this page.
The inquiry form (client component, uses
useSearchParams)The copy-email button (client component)
A promotional banner (static markup)
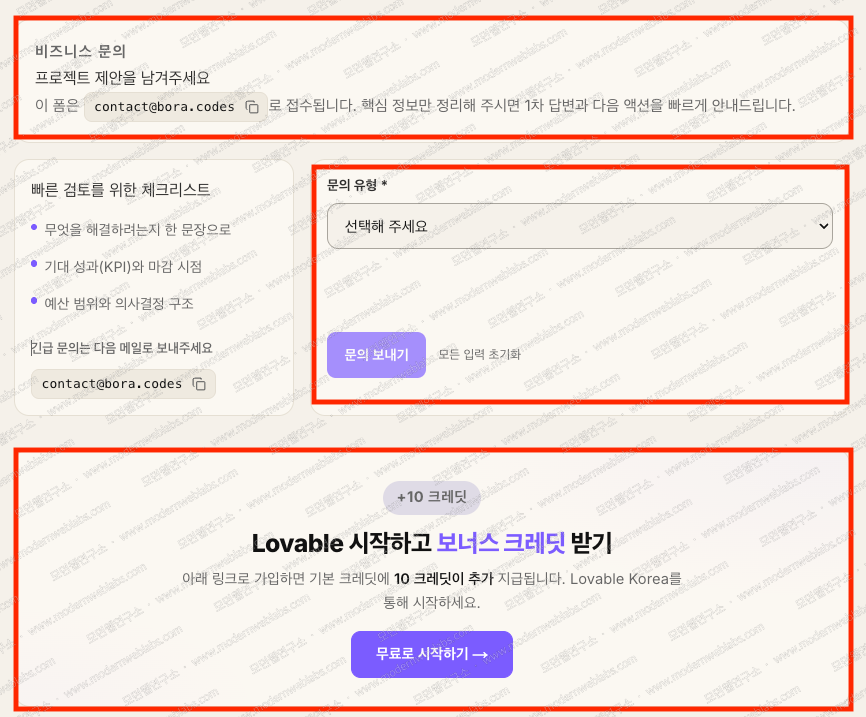
My gut said #1 was the most suspicious, since it was a complex form tangled up with useSearchParams and Suspense. But you can't start from gut feeling.
Newsletter
Notes vetted by enterprise practitioners, every two weeks.
Notes on Claude Code, GitHub Copilot, AI-native engineering strategy, and adoption case studies, curated every two weeks.
Step 3: Remove one at a time and bisect
I started by removing the most suspicious element first, rebuilding each time to isolate the cause. I made sure to change only one variable at a time.
Build after removing the form           → Still errors  (form is innocent)
Build after removing the email button paragraph → Error gone     (culprit isolated)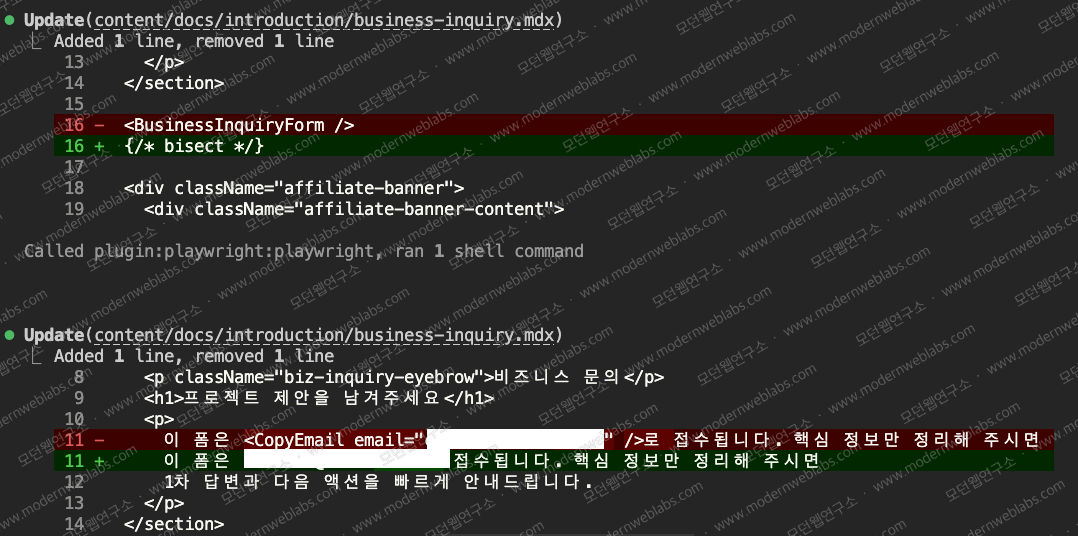
The form, my top suspect, turned out to be innocent. If I had followed my gut and started tearing the form apart, I would have burned time fixing a bug that did not exist. Eliminating variables one by one takes rebuild time, but the results are binary and leave no room for debate in interpretation. With n elements, this takes n rebuilds in the worst case, or log n rebuilds if you bisect.
Step 4: Strip the minification and get a diagnosis in plain text
We knew where the culprit was, but not why. React's dev build points to the exact location of a hydration mismatch with a tree diagram, so we decided to use it. The problem was that GTM sits behind a production gate (NODE_ENV === "production"), so it doesn't load on the dev server.
We solved this by temporarily opening the gate. Just don't commit the change.
// Temporary change for investigation. Do not commit const isProd = process.env.NODE_ENV === "production" || process.env.FORCE_ANALYTICS === "1";The dev server gave us the answer to "why."
In HTML, <p> cannot be a descendant of <p>. This will cause a hydration error.The cause was this markup in an MDX file.
<p> 이 폼은 <CopyEmail email="..." />로 접수됩니다. 핵심 정보만 정리해 주시면 1차 답변과 다음 액션을 빠르게 안내드립니다. </p>When a JSX tag spans multiple lines, MDX parses the inner text as a block and wraps it in an extra <p>. The result is <p><p>…</p></p>. The HTML spec does not allow a p inside a p, so the browser parser forcibly closes the outer p. The DOM the server sent no longer matches the tree React expects, and a hydration error occurs. Collapsing it onto a single line fixes the problem.
<p>이 폼은 <CopyEmail email="..." />로 접수됩니다. 핵심 정보만 정리해 주시면 1차 답변과 다음 액션을 빠르게 안내드립니다.</p>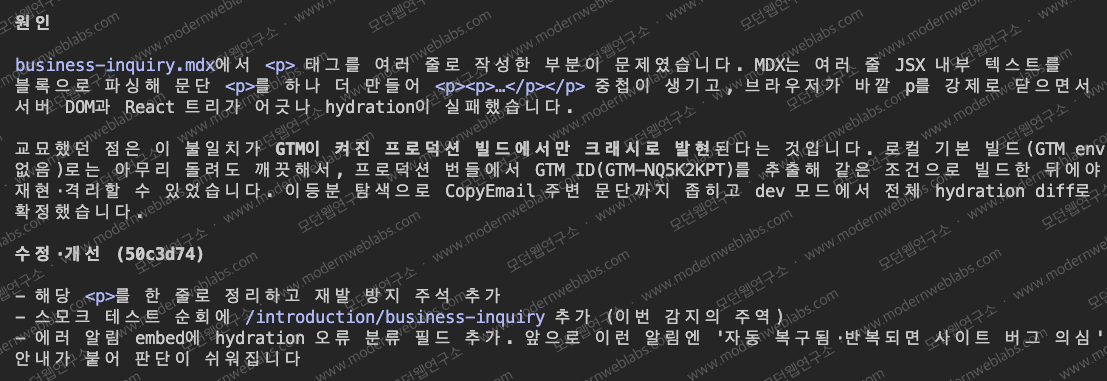
Step 5: Verify the monitoring net before shipping the fix
After the fix, before deploying, I checked one thing first. Does the monitoring net actually catch this bug? I ran the third-layer smoke test from Step 0 against the pre-fix code and confirmed it failed, then confirmed it passed after the fix. A monitoring net that cannot detect goes silent on the next regression. While the bug is still alive is the only chance to verify the net's detection ability.

Wrap-up
Three principles drove this procedure.
Change one variable at a time. If you patch several places at once based on a hunch, you will never know which change actually helped. Elimination experiments look slow, but each step yields a definitive conclusion, so they finish fastest overall.
Make the reproduction environment identical to production. "It doesn't happen locally" is not the end of debugging, it's the start. Line up the points where local and production differ, build-time environment variables, analytics scripts, the CDN, and the reproduction conditions themselves become clues.
Set up observation tools first. This bug self-recovers, so watching the screen alone would never reveal it. Without the monitoring layers described in Step 0, we would not have known it existed and this article would not exist either. Even without subscribing to an external service like Sentry, one instrumentation file and one API route are enough to start your own error monitoring. The existence of a monitoring net matters more than its size.
Originally published at Modern Web Labs (www.modernweblabs.com). © Modern Web Labs. All rights reserved.
Newsletter
Notes vetted by enterprise practitioners, every two weeks.
Notes on Claude Code, GitHub Copilot, AI-native engineering strategy, and adoption case studies, curated every two weeks.
Modern Web Labs · Consulting
You read it. Now bring it into your team.
If the patterns in this post fit your situation, start with a short conversation about how to apply them.
How we can help
Claude Code · GitHub Copilot
Two-day hands-on plus AI-graded in-house certification
AI-Native Strategy
Redesign operating standards, measurement, and governance
Web Platform
Building full-stack services on Next.js